My Projects
See some of my coding projects here. Each project will have a summary, one of the visualizations created (if part of the project), and a link to the project's GitHub repository.

Turnover Impact (in progress)
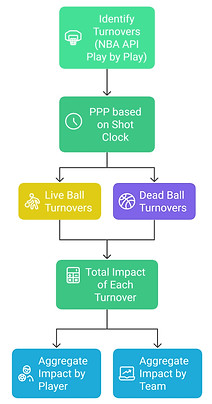
Turnovers are one of the most impactful events in basketball and can quickly swing the outcome of a game, but tracking of the context around turnovers is limited. This project incorporates the context around turnovers to evaluate just how impactful a turnover is on the outcome of a basketball game using variables such as shot clock remaining, live vs dead ball turnovers, and the results of the next possession. This impact determination is then applied to players/teams to measure the aggregated effect of their turnovers. Current in progress work is updating shot clock PPP, developing a Flask host for the database, and setting up an automated pipeline for the data from the NBA API to the AWS database.
CFP Simulator
Analyzed and presented to Navigate leadership an advanced college football playoff prediction tool centered around the new conference realignments and playoff automatic qualifiers. The tool uses Python and Elo data to simulate 10,000 full seasons and compare outputs for different combinations of 20 easily adjustable variables. The tool is implemented in GitHub Actions with automatic creation of organized CSV files to simply view the results of various inputs.


Green and Blue City
Research of green and blue spaces in the city of Boston for the non-profit organization, Mass Ave Coalition. Created interactive geographical visualization showing distribution of open spaces and trees in Boston with linked bar chart and user tooltip. Hosted visualizations and further contextual information on website coded with HTML: Link.
Sumner Tunnel Analysis
The closing of a major thoroughfare in Boston, the Sumner Tunnel, caused large transportation changes for the MBTA as over 40,000 daily travelers had to adjust their routine. This project analyzed changes in ridership with a focus on the blue and orange rail lines, to contribute to the MBTA Travel Behavior Memo. Using timestamp data to view ridership before an after the closing of the tunnel, calculated percentage change of ridership on both the overall line level and narrowed down to individual stops on each line. In addition, evaluated the data for any missing tracking data and communicated the necessary updates.

NBA Playoff Predictor
Predicted results of the 2023 NBA Playoffs comparing machine learning techniques of multiple regression, K-Nearest Neighbor, and Random Forest using SciKit-learn. Scraped and cleaned 50+ public NBA datasets spanning from 2010-present with Pandas and mapped teams to scraped playoff success data in each corresponding year. Optimized models with hyperparameter tuning and feature importance.

General Manager Simulator
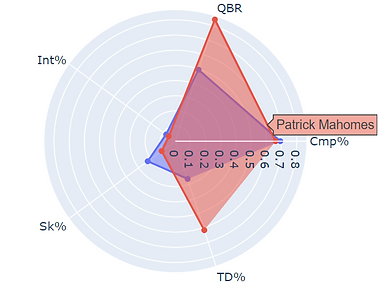
Designed functional NFL general manager simulator using a Plotly dashboard, allowing users to draft a team under league salary cap with functionality to filter, sort, search, add/remove players. Dashboard includes a projected win total over a 17 game season for the drafted team based off a multiple regression machine learning model as well as radar chart and field view visualizations to aid selection of players.
SQL-Py Library
Created a virtual library linked to a books database in SQL. The library operates within a python terminal as an online library website typically would. It provides user functionality as either a librarian or a member. The librarian can handle more administrative tasks such as adding or removing books, modifying books, and creating and maintaining book clubs. The members are guests in the library and as such their functionality includes tasks such as creating an account, borrowing and returning books, and joining book clubs.


Sunspot Dashboard
Created an interactive dashboard exploring solar activity trends using Plotly and HTML packages Python. There are three different visualizations that all display various details of solar activity including a line chart, a scatterplot, and a live-view animated image. Both the line chart and scatterplot incorporate user interactivity that will adjust the display of the figures. This dashboard can be used as a resource that can be used to better understand and predict sunspot and solar activity behavior before it happens.
NCAA Tournament Likelihood
Exploring a NCAA college basketball team's chances of making the NCAA Tournament based on statistics and basic machine learning algorithms. Cleaned and analyzed public data from Sports-Reference using join plots and box plots from the Seaborn library. Finally, ran a multiple regression binary classifier that predicted a team's chances of making the tournament with 92% accuracy.


Screenplay Analysis
The screenplay NLP project involves working with TV script data regarding the frequency of words and sentiment analysis to construct sankey diagrams, word clouds, and line plots. The project involved scraping screenplay scripts from screenplays.io and then using natural language processing to pull out word frequency and sentiment analysis.
NBA Positionality
Utilize the altair python library to complete exploratory analysis on basic statistics based on positions for NBA players and create interactive visualizations. Use data from Basketball Reference and aggregate per game stats based on positions of each player.

Chess Opening Analysis
Investigates chess openings and strategy using data from the well known site Lichess. Uses data containing information on player ratings, openings, and results per game for over 20,000 games. Splits the games based on openings and rating of the players and creates plots by opening for winning percentage with both white and black pieces. Displays winning percentage for both white and black as well as draw percentage at different rating levels.
